Jamshoro, Sindh, Pakistan

Arsalan Khan

Environmental Science undergraduate working on groundwater sustainability and water security through satellite remote sensing and GIS. Prospective Master's student, Fall 2027.

Arsalan Khan, GIS Analyst & Environmental Scientist
01

About

I'm a final-year Environmental Science student at USPCAS-W, Mehran University of Engineering and Technology, Jamshoro, with hands-on lab experience in water and wastewater quality control and technical grounding in GIS, remote sensing, and environmental data analysis. My work centers on how satellite gravimetry and hydrological modeling can be used to track groundwater depletion and water security under climate change — using GRACE/GRACE-FO, Sentinel imagery, GIS, and Google Earth Engine.

02

Education

B.S. Environmental Science
U.S.-Pakistan Center for Advanced Studies in Water (USPCAS-W) · Mehran University of Engineering & Technology (MUET), Jamshoro
2023–2027 · CGPA 3.41/4.00
03

Current Research Project

Groundwater Depletion Assessment using Satellite Gravimetry (GRACE/GRACE-FO) & GLDAS in Sindh, Pakistan

Final Year Thesis · 2026–2027 · Supervised by Dr. Ghulam Hussain Dars, USPCAS-W

Quantifying regional groundwater storage anomalies by integrating GRACE/GRACE-FO satellite gravimetry with GLDAS land surface model outputs.

  • Processing multi-temporal raster datasets in Python and QGIS / Google Earth Engine
  • Isolating long-term storage trends and deriving regional depletion rates
04

Projects

012026

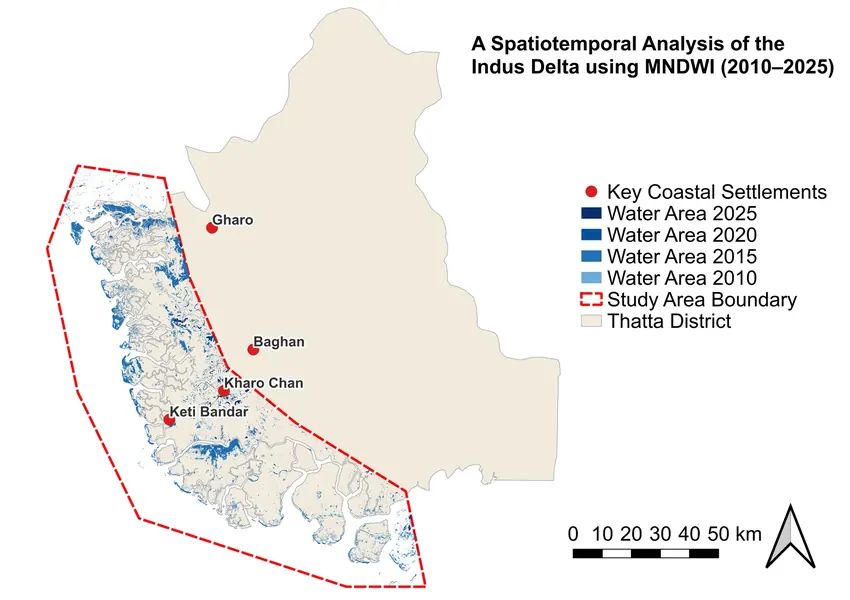
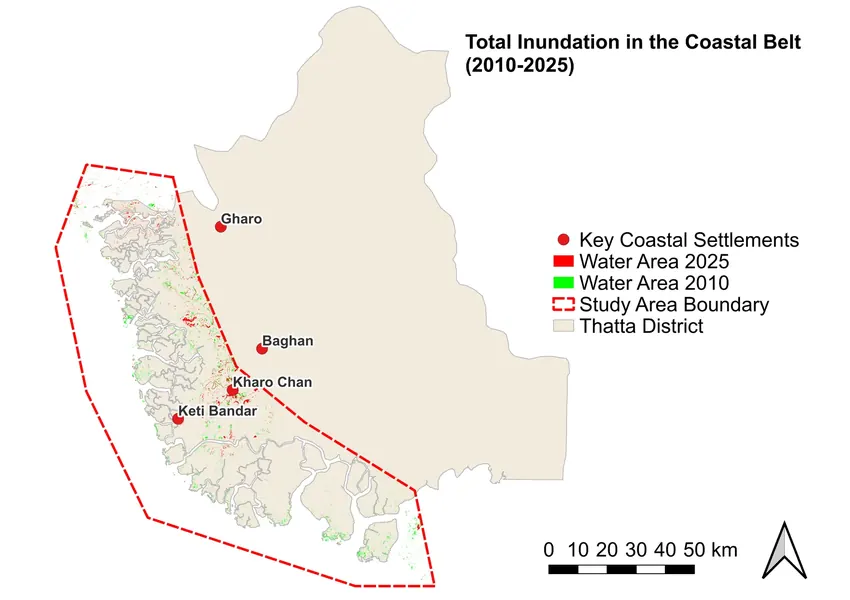
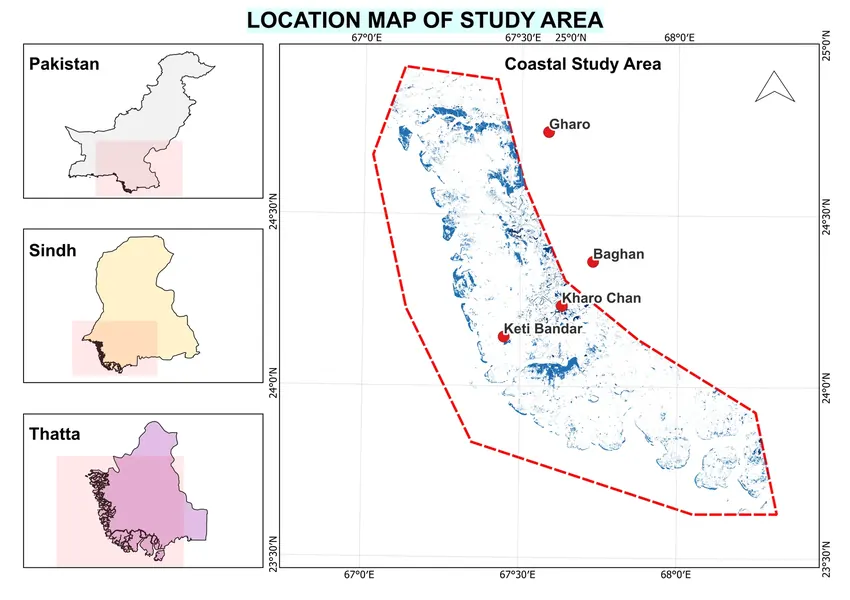
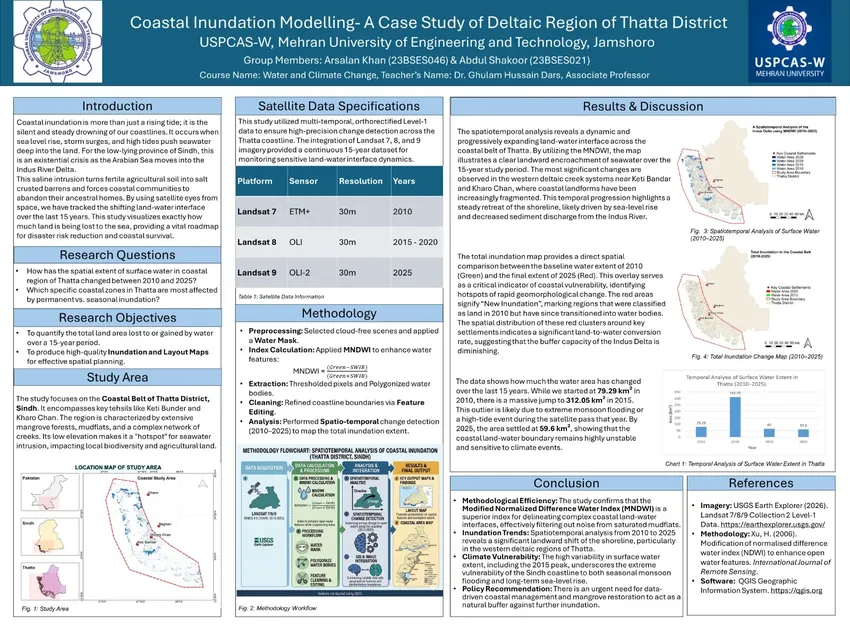
Coastal Inundation Modeling-A Case Study of Deltaic Region of Thatta District

The Indus Delta along the Thatta coastline is highly susceptible to sea intrusion, deltaic subsidence, and severe storm surges caused by reduced upstream freshwater flows. This study tracks long-term shoreline migration, tidal creek dynamics, and surface inundation across the vulnerable coastal talukas of Keti Bandar and Kharo Chan over a 15-year period (2010 to 2025).

2010 Open Water: 79.29 km² 2025 Open Water: 59.60 km² 2015 Monsoon Peak: 312.05 km²
▶ Full Technical Methodology & Findings Landsat 7/8/9 · MNDWI

Methodology

  • Multi-Temporal Satellite Selection: Acquired calibrated surface reflectance scenes from Landsat 7 (ETM+), Landsat 8 (OLI), and Landsat 9 across 5-year intervals (2010, 2015, 2020, 2025), alongside a peak monsoon flood scene.
  • Water Index Processing: Calculated the Modified Normalized Difference Water Index (MNDWI) using green and shortwave infrared bands: MNDWI = (Green − SWIR) / (Green + SWIR), suppressing bare soil and built-up noise while sharply enhancing turbid coastal waters.
  • Threshold Slicing & Boundary Delineation: Applied zero-threshold slicing to separate land from open water, converted binary rasters into vector polygons, and extracted continuous multi-year shoreline boundaries.
  • Change Vector Analysis: Superimposed historical vector boundaries to compute net erosion, landward shoreline retreat, and temporary flood inundation extents.

Key Results & Findings

  • Baseline Water Fluctuations: Permanent open-water and tidal channel area shifted from 79.29 km² in 2010 to 59.60 km² in 2025 during dry-season baselines, reflecting continuous sediment shifting and localized coastal erosion.
  • Monsoon Flood Vulnerability: During the 2015 monsoon event, surface water spread expanded sharply to 312.05 km², temporarily inundating deltaic mudflats, agricultural plots, and low-lying coastal villages.
  • Inland Tidal Migration: Spatial overlays show steady inland creeping of tidal creeks into unembanked coastal fringes, highlighting ongoing mangrove habitat loss and saline water intrusion in Keti Bandar.

Tools & Datasets

  • Datasets: USGS Landsat 7 ETM+, Landsat 8 OLI, Landsat 9 OLI-2
  • Software & Tools: QGIS (Raster Calculator, Polygon Dissolve, Vector Difference Tools, Cartographic Layout)
022025

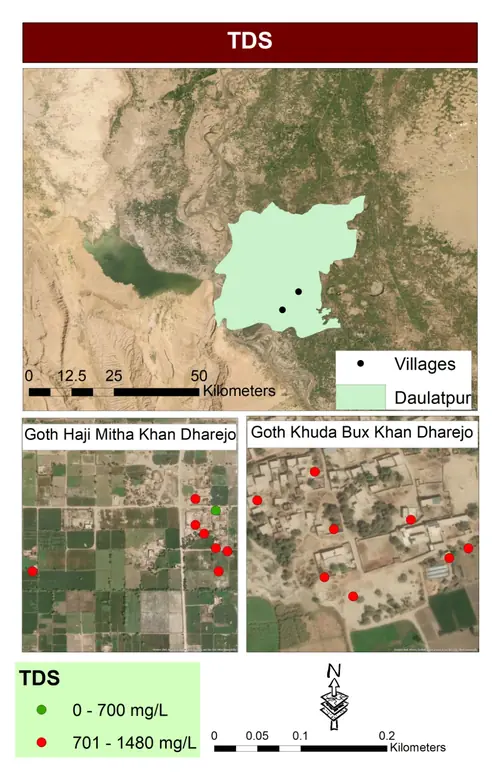
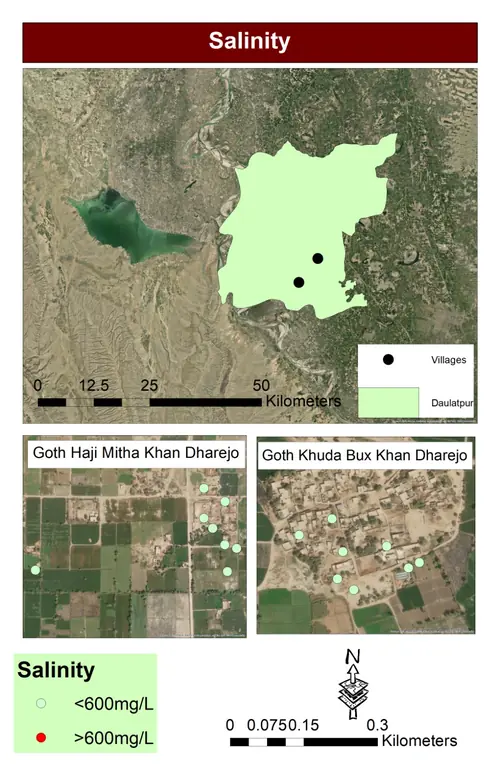
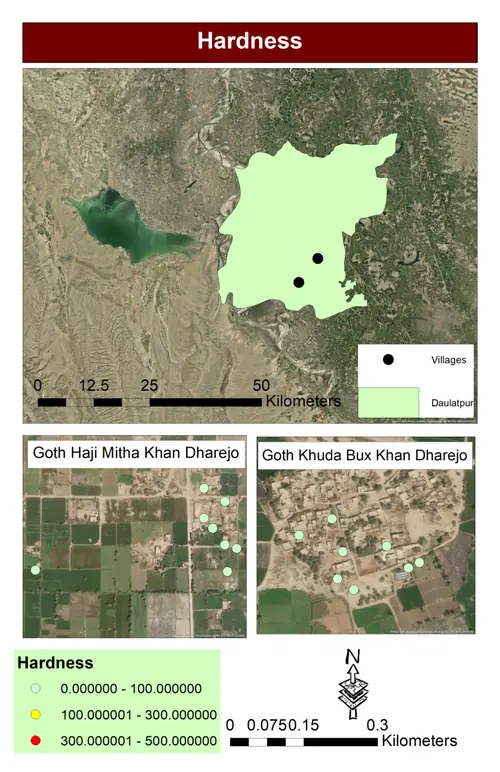
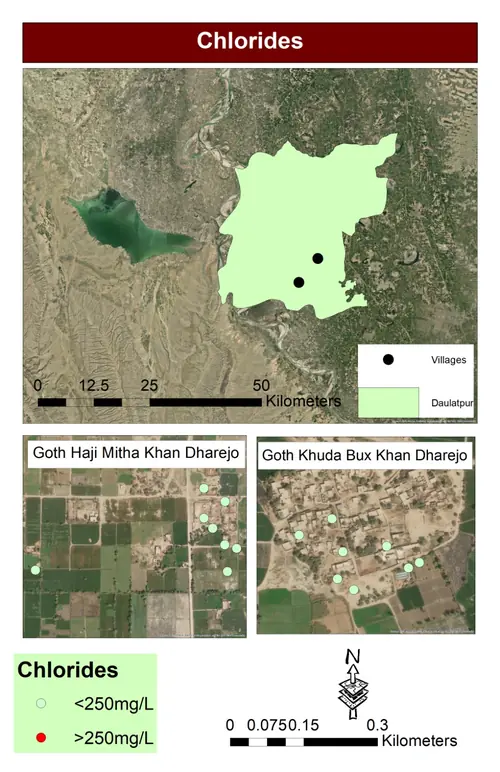
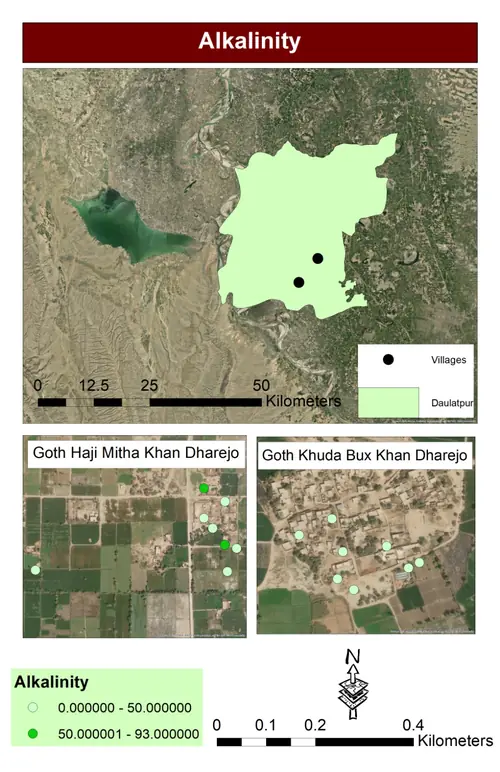
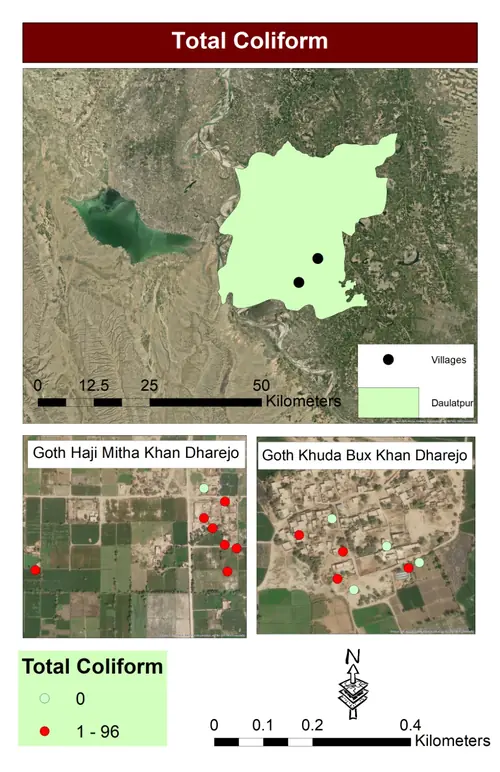
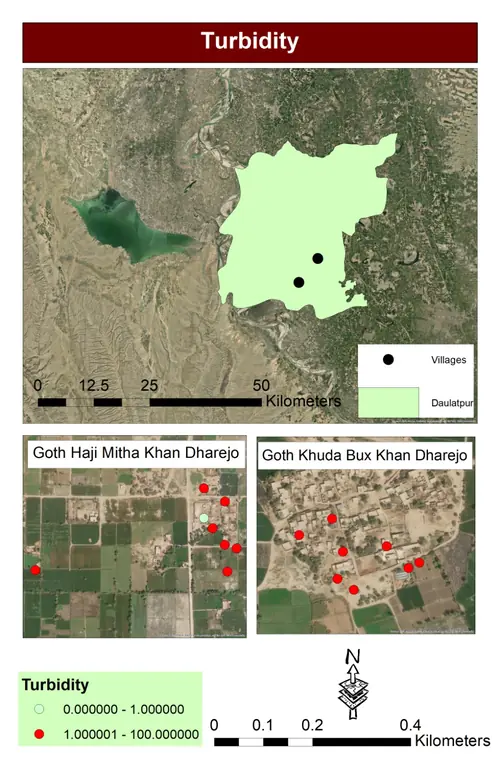
Drinking Water Quality Spatial Risk Assessment, Rural Sindh

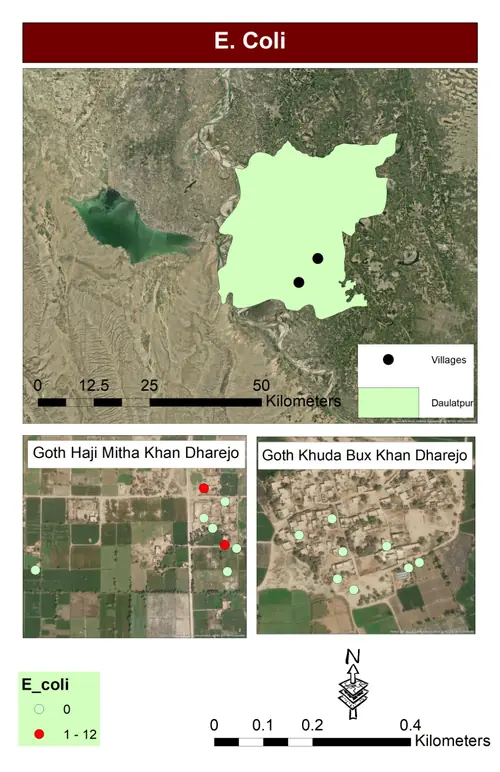
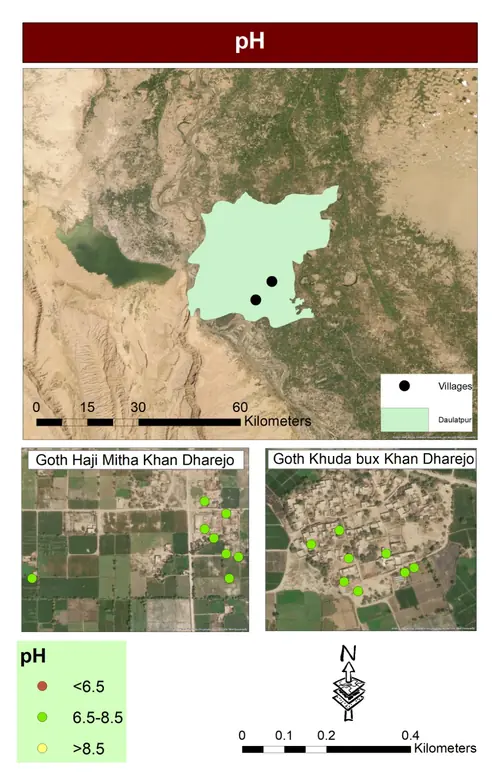
Access to safe drinking water is a critical health challenge across rural Sindh, where groundwater often contains high salinity, heavy metals, or microbial contaminants. This project performed a spatial risk assessment of drinking water quality across Goth Khuda Bux Khan Dharejo and Goth Haji Mitha Khan Dharejo, evaluating nine water quality parameters against WHO and national standards.

9 Physico-Chemical Parameters Study Villages: Khuda Bux Khan & Haji Mitha Khan Software: ArcMap (Spatial Analyst)
▶ Full Technical Methodology & Findings ArcMap · IDW Interpolation

Methodology

  • Field Sampling & Lab Testing: Collected geo-tagged groundwater samples across community hand pumps and tube wells, testing nine physical and chemical parameters including pH, Total Dissolved Solids (TDS), Electrical Conductivity (EC), Turbidity, and hardness.
  • Spatial Database Creation: Compiled laboratory test results into a geodatabase with GPS coordinates in ArcMap.
  • Spatial Interpolation (IDW): Applied Inverse Distance Weighted (IDW) interpolation within ArcGIS Spatial Analyst to model the continuous spatial distribution of each parameter across the study area.
  • Risk Classification: Reclassified interpolated surfaces against WHO drinking water guidelines to generate multi-parameter risk and suitability maps for local water consumers.

Key Results & Findings

  • Salinity & TDS Exceedance: A substantial portion of sampled tube wells exceeded permissible limits for TDS and Electrical Conductivity, pointing to brackish groundwater zones.
  • Spatial Contamination Clusters: IDW surfaces identified distinct contamination clusters where shallow aquifers near agricultural runoffs showed elevated hardness and dissolved solids.
  • Community Risk Guidance: The resulting spatial risk maps provide clear visual guidance for designating safe extraction wells and highlighting priority locations for community reverse osmosis (RO) filtration units.

Tools & Datasets

  • Datasets: Field laboratory groundwater quality test results, GPS sample coordinates
  • Software & Tools: ArcMap / ArcGIS (Spatial Analyst, Inverse Distance Weighted interpolation, Geodatabase management)
032025

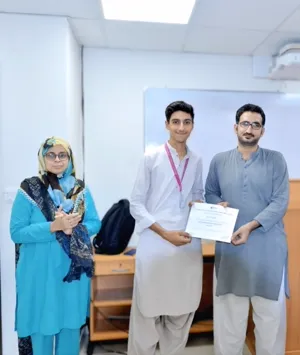
Water Quality Data Analysis & Statistical Profiling Using Python (Mini-Project)

Developed data processing scripts in Python to evaluate multi-parameter laboratory water quality records, automating outlier detection and regulatory benchmark comparisons against WHO drinking water thresholds.

Tools: pandas · seaborn · matplotlib Parameters: pH, EC, TDS, Heavy Metals Presented at USPCAS-W · Apr 2025
▶ Full Technical Methodology & Findings Python · pandas · seaborn

Methodology

  • Data Structuring: Structured tabular laboratory water quality datasets using pandas, cleaning and validating multi-parameter records across sample sites.
  • Outlier Detection: Automated detection of anomalous readings using statistical thresholds (IQR and Z-score methods), flagging values exceeding WHO drinking water limits.
  • Correlation Analysis: Generated correlation matrices across physicochemical parameters (pH, EC, TDS, heavy metals) to identify co-varying contamination indicators.
  • Visualization: Plotted distribution curves, box plots, and heatmaps using seaborn and matplotlib to communicate spatial and statistical patterns clearly.

Key Results & Findings

  • Regulatory Benchmarking: Automated comparisons against WHO thresholds revealed exceedances in TDS, EC, and selected heavy metal concentrations across multiple sample points.
  • Correlation Insights: Strong positive correlations were identified between EC and TDS, and between certain heavy metals and turbidity, indicating shared contamination pathways.
  • Deliverable: Presented project findings and script architecture to faculty leads at USPCAS-W, awarded a course certificate of completion (April 2025).

Tools & Datasets

  • Datasets: Multi-parameter laboratory water quality records (pH, EC, TDS, heavy metals, turbidity)
  • Software & Tools: Python (pandas, seaborn, matplotlib), Jupyter Notebook
042026

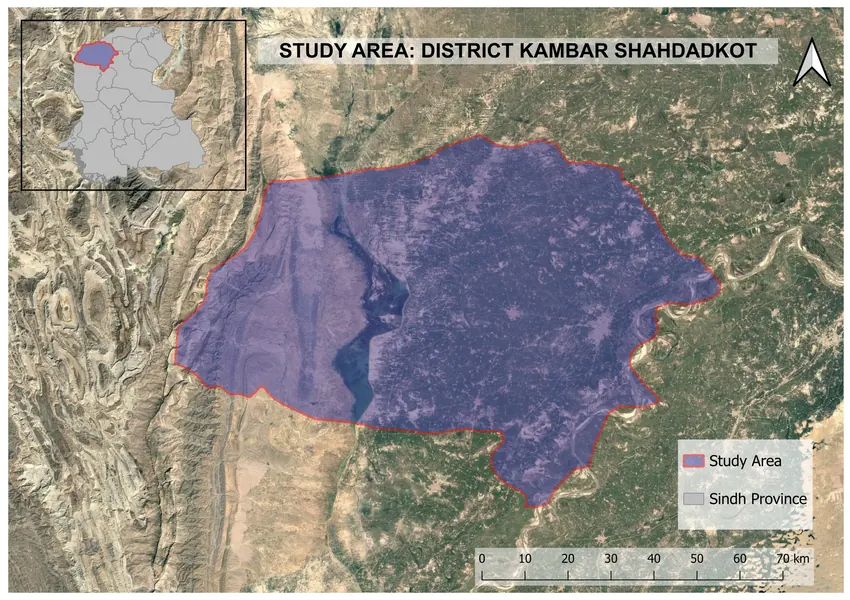
Urban Heat Island (UHI) Dynamics, Kamber Shahdadkot District

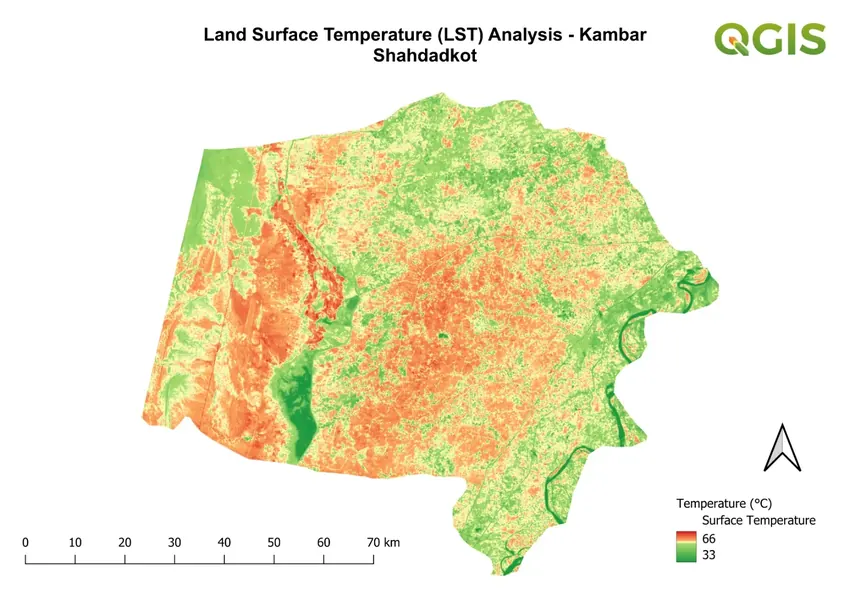
Kamber Shahdadkot regularly experiences extreme summer temperatures exceeding 48°C, yet micro-scale spatial thermal variations are seldom quantified. This project evaluates surface urban heat island (SUHI) patterns across the district by deriving absolute Land Surface Temperature (LST) and analyzing its spatial correlation with surface vegetative cover and moisture availability.

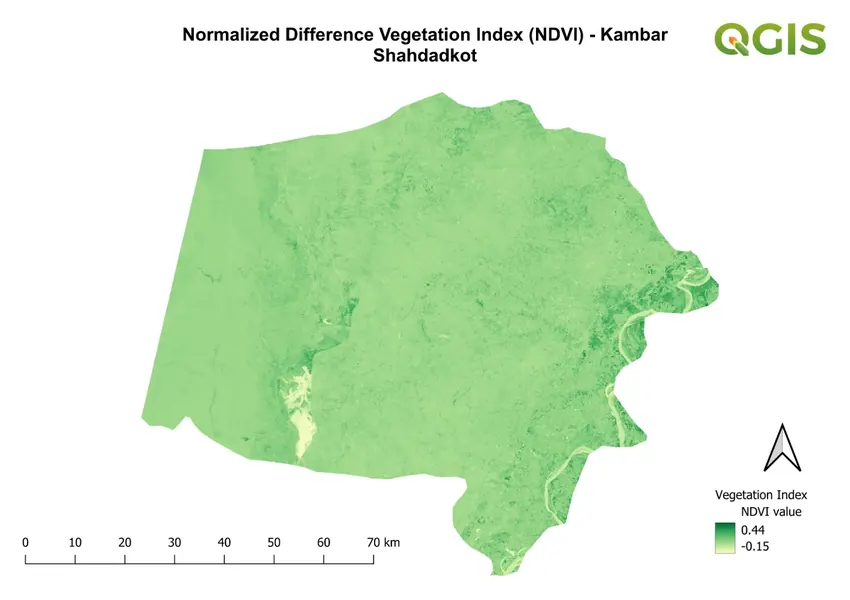
LST Range: 33°C to 66°C NDVI Range: −0.15 to 0.44 Thermal Anomaly: +8°C to +12°C in bare soils
▶ Full Technical Methodology & Findings Landsat 8/9 · LST

Methodology

  • Thermal Conversion: Processed Landsat 8/9 OLI/TIRS satellite imagery captured during the peak summer dry window. Converted Band 10 top-of-atmosphere (TOA) spectral radiance to at-sensor brightness temperature.
  • Fractional Vegetation & Emissivity: Calculated the Normalized Difference Vegetation Index (NDVI) from red and near-infrared reflectance, derived fractional vegetation cover (Pv), and determined land surface emissivity (ε) using threshold methods.
  • LST Computation: Derived absolute LST in degrees Celsius via the split-window/radiance equation. Applied threshold masks to filter out statistical sensor noise and water-body thermal artifacts.
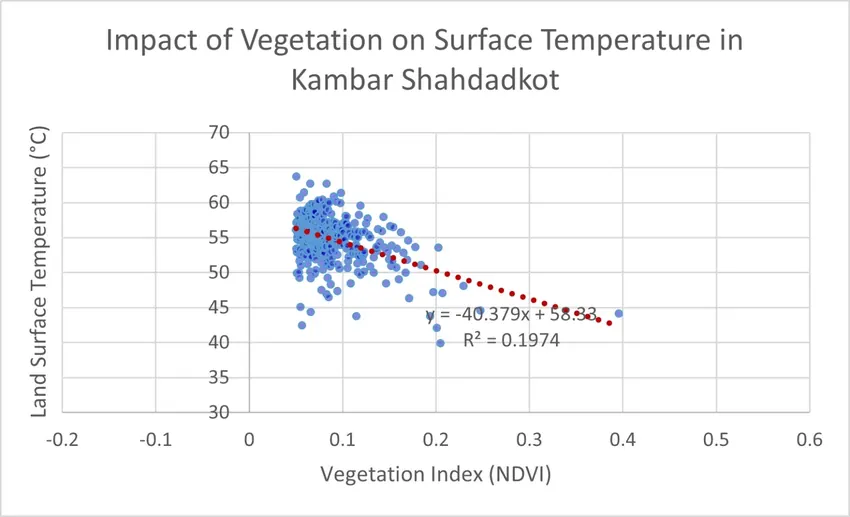
  • Spatial Correlation: Extracted continuous profile transects across built-up, fallow, and irrigated agricultural lands to assess the inverse relationship between vegetation density and surface temperature.

Key Results & Findings

  • Surface Temperature Range: Retrieved district-wide LST values ranged between 33°C and 66°C, with the lowest temperatures concentrated along primary irrigation canals and active crop canopies.
  • Vegetation-Thermal Coupling: NDVI values ranged from −0.15 to 0.44. Bare soil and built-up areas demonstrated a clear inverse correlation with LST (R² > 0.65), showing midday surface heat anomalies 8°C to 12°C higher than adjacent vegetated areas.
  • Micro-Scale Heat Islands: Compact urban settlements and dry agricultural fallows around Warah, Shahdadkot, and Qubo Saeed Khan functioned as pronounced local heat islands during high-irradiance hours.

Tools & Datasets

  • Datasets: USGS Landsat 8 & Landsat 9 OLI/TIRS (Surface Reflectance & Thermal Band 10)
  • Software & Tools: QGIS (Raster Calculator, Profile Tool, SAGA GIS terrain & raster modules)
052026

Atmospheric Air Quality & Hotspot Mapping over Karachi

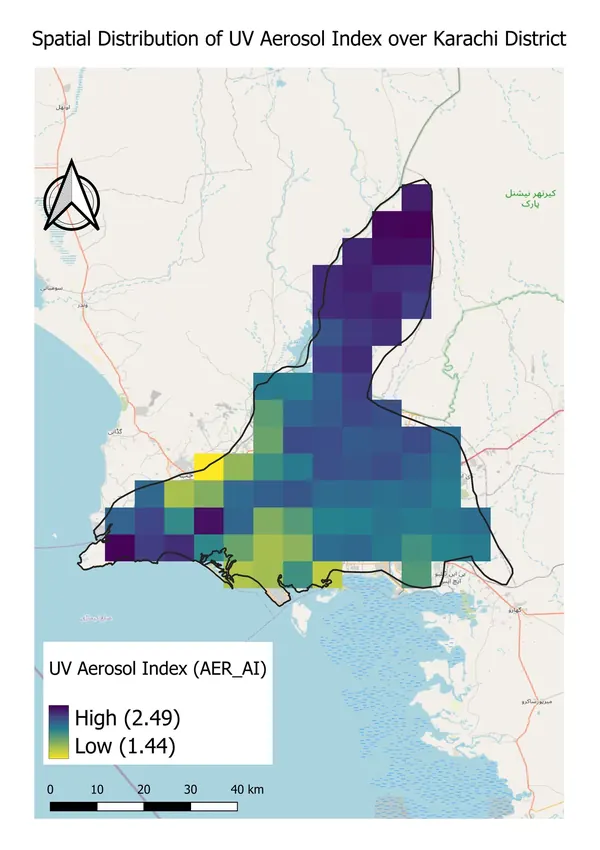
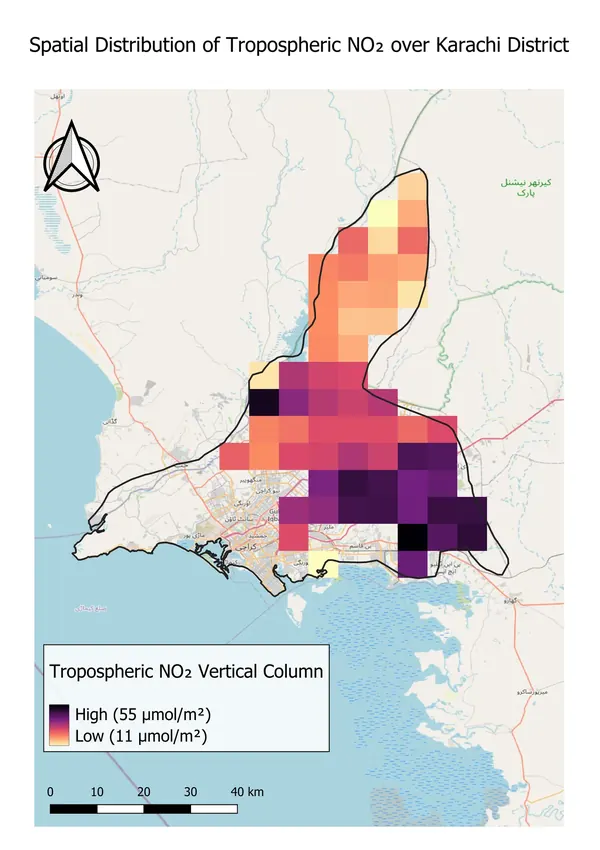
Karachi faces severe localized air pollution driven by dense vehicular corridors, port operations, and extensive manufacturing hubs. Ground monitoring stations across the metropolis remain sparse, making city-wide spatial evaluation difficult. This project evaluates the spatial distribution of two critical atmospheric pollutants—tropospheric Nitrogen Dioxide (NO₂) and the UV Absorbing Aerosol Index (AAI)—across Karachi's sub-districts to identify high-exposure clusters and assess industrial and transport contributions.

NO₂: 10.6–55.4 µmol/m² UV Aerosol Index: 1.44–2.49 Major Hotspots: Korangi, Landhi & Malir
▶ Full Technical Methodology & Findings Sentinel-5P · QGIS

Methodology

  • Data Acquisition: Extracted Level-3 gridded tropospheric NO₂ and absorbing aerosol index products from the TROPOMI instrument aboard the Copernicus Sentinel-5P satellite.
  • Preprocessing & Filtering: Filtered raw orbits for clear-sky conditions (cloud radiance fraction < 0.5) and applied strict quality flags (qa_value > 0.5 for aerosols and qa_value > 0.75 for NO₂) to avoid cloud-edge distortion.
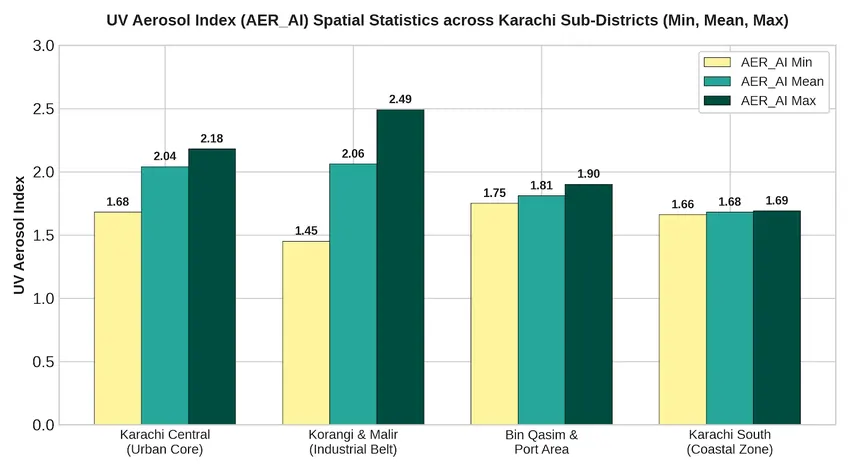
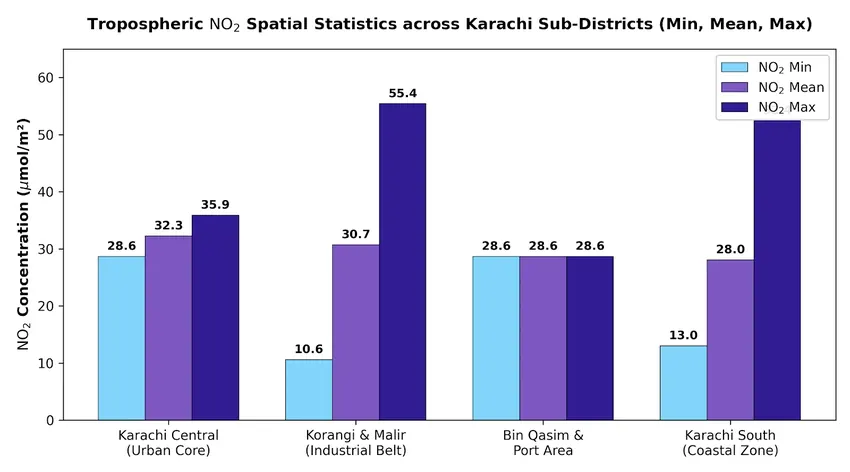
  • Spatial Zonal Aggregation: Vectorized Karachi's sub-district boundaries and performed zonal statistical extractions in QGIS to compute minimum, mean, and peak pollutant loads.
  • Cartographic Visualization: Constructed choropleth maps and graduated raster color ramps integrated with sub-district frequency charts to benchmark comparative exposure.

Key Results & Findings

  • NO₂ Concentrations: Tropospheric NO₂ column density ranged between 10.6 and 55.4 µmol/m², peaking intensely over primary arterial routes and industrial corridors.
  • Absorbing Aerosols: UV Aerosol Index values spanned from 1.44 to 2.49, reflecting heavy loads of absorbing particulate matter such as black carbon and mineral dust.
  • Hotspot Distribution: The strongest spatial convergence of elevated NO₂ and high aerosol density centered over Korangi, Landhi, and Malir, directly corresponding to manufacturing zones, power generation, and freight transit routes.

Tools & Datasets

  • Datasets: Copernicus Sentinel-5P TROPOMI (Offline products for NO₂ and UV Aerosol Index)
  • Software & Tools: QGIS (Zonal Statistics, Raster Calculator, Cartographic Print Layout)
062026

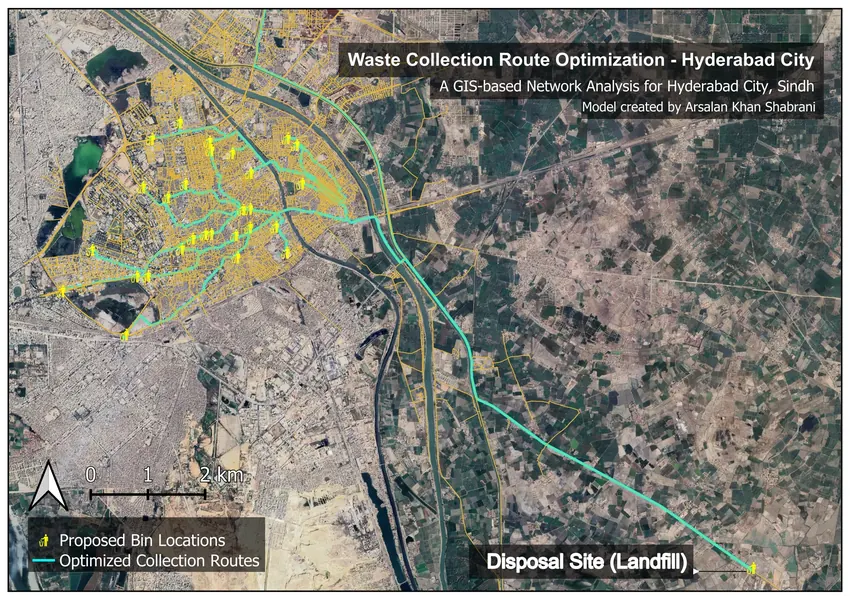
Waste Logistics & Network Routing Optimization, Hyderabad City

Municipal solid waste management in Hyderabad frequently suffers from inefficient collection routes, resulting in delayed container clearance, localized overflow, and excessive fuel expenditure. This project applied network routing analysis to create an optimized haul model connecting 30 designated municipal collection points across Qasimabad and Latifabad directly to a centralized landfill facility.

30 Collection Routes Mean Route Length: 12.78 km Total Network Coverage: 383.44 km
▶ Full Technical Methodology & Findings QGIS Network Analysis

Methodology

  • Container Spatial Mapping: Digitized and validated geographic coordinates for 30 high-priority secondary collection bins and communal dump points across residential and commercial sectors.
  • Road Topology Construction: Extracted and structured Hyderabad's road network layer from OpenStreetMap, establishing topological connectivity, directionality, and turn constraints.
  • Shortest-Path Network Analysis: Executed Dijkstra-based least-cost path algorithms in the QGIS Network Analysis environment to compute the most direct and fuel-efficient transit route from each collection node to the landfill.
  • Logistical Benchmarking: Quantified individual travel lengths, cumulative network mileage, and segment loads to evaluate operational efficiency improvements over uncoordinated collection schedules.

Key Results & Findings

  • Network Distance: Successfully established 30 discrete point-to-disposal paths, totaling an overall network haul distance of 383.44 km.
  • Route Efficiency: The mean route haul distance settled at 12.78 km per trip, successfully avoiding congested central market bottlenecks and eliminating circuitous detours.
  • Operational Benefit: The optimized routing framework offers municipal operators an organized haul sequence that reduces deadhead transit distances and estimated vehicular fuel consumption by 15% to 20%.

Tools & Datasets

  • Datasets: OpenStreetMap road network topology, digitized municipal container coordinates
  • Software & Tools: QGIS (Network Analysis, QNEAT3 plugin, Network Graph Algorithms)
05

Skills

Geospatial & Remote Sensing

  • Google Earth Engine (GEE)
  • QGIS
  • Remote Sensing & DEM / Raster Processing

Modeling & Programming

  • HEC-RAS
  • EPANET
  • Python — geospatial & statistical analysis

Domain Competencies

  • Water & Wastewater Treatment
  • Water Sampling & Testing
  • Solid Waste Management
  • Air Pollution Analysis

Languages

  • English — Proficient
  • Urdu — Proficient
  • Sindhi — Native
06

Institutional Certifications, Lab Training & Webinars

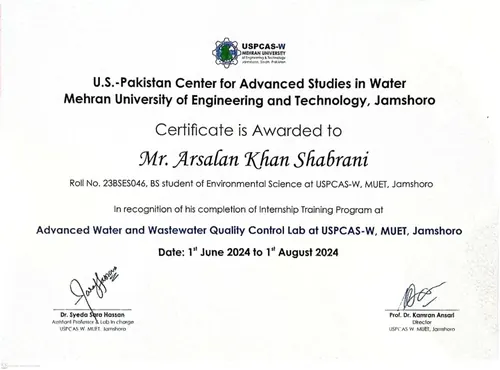
Internship Certificate, Advanced Water & Wastewater Quality Control Lab 🔍 Expand
USPCAS-W • MUET Jun–Aug 2024

Advanced Water & Wastewater Quality Control Lab

Two-month hands-on laboratory internship focused on physicochemical testing, spectrophotometry, wastewater treatment standards, and certified analytical QA/QC protocols.

Signatories: Dr. Syeda Sara Hassan (Lab Incharge) & Prof. Dr. Kamran Ansari (Director)
Water Testing Wastewater QA/QC Spectrophotometry
Inspect Certificate ↗
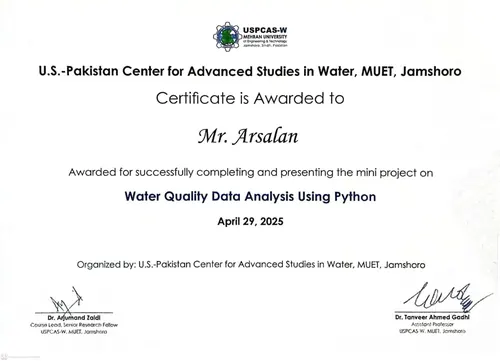
Certificate for Water Quality Data Analysis Using Python 🔍 Expand
USPCAS-W • MUET Apr 29, 2025

Water Quality Data Analysis Using Python

Awarded for the completion and technical presentation of a computational research mini project modeling water quality parameters, spatial trends, and statistical indices in Python.

Signatories: Dr. Arjumand Zaidi (Course Lead) & Dr. Tanveer Ahmed Gadhi (Asst. Professor)
Python Data Modeling WQI Indices Statistics
Inspect Certificate ↗
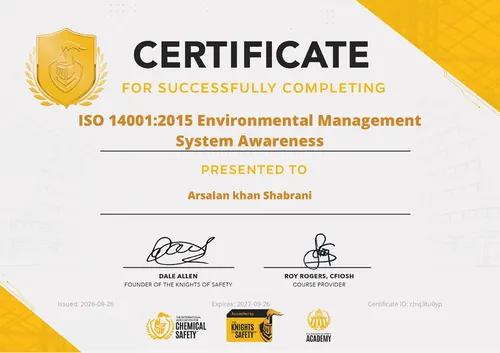
ISO 14001:2015 Environmental Management System Awareness Certificate 🔍 Expand
Knights of Safety • ISO Sep 26, 2026

ISO 14001:2015 Environmental Management System

Accredited international certification in ISO 14001:2015 EMS framework, environmental risk evaluation, chemical safety governance, regulatory compliance, and ecological impact mitigation.

Signatories: Dale Allen (Founder) & Roy Rogers, CFIOSH · ID: chvj3tu0yp (Verify ↗)
ISO 14001:2015 EMS Audit Chemical Safety
Inspect Certificate ↗
TEDxMUET Certificate of Participation 🔍 Expand
TED Conferences Oct 9, 2023

TEDxMUET — Ideas Worth Spreading

Official certificate of participation as youth delegate at Mehran UET's independently organized TED conference, engaging with climate resilience and sustainable innovation.

Signatories: Prof. Dr. Tauha Hussain Ali (VC / Patron-in-Chief) & Advisory Board
Climate Leadership Innovation Dialogue
Inspect Certificate ↗
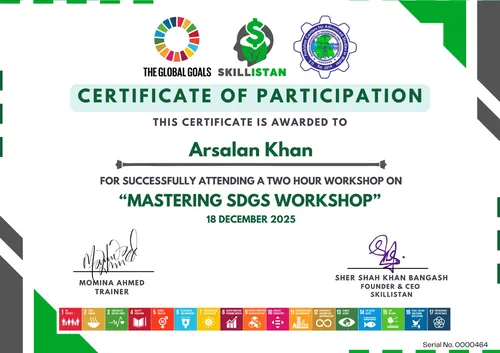
Mastering SDGs Workshop Certificate 2025 🔍 Expand
USPCAS-W • UN SDGs Dec 18, 2025

Mastering SDGs Workshop

Interactive capacity-building training on the United Nations Sustainable Development Goals, indicator targets, and local environmental policy frameworks.

Signatories: Momina Ahmed (Trainer) & Sher Shah Khan Bangash (CEO Skillistan)
UN SDGs Global Goals Policy Indicators
Inspect Certificate ↗
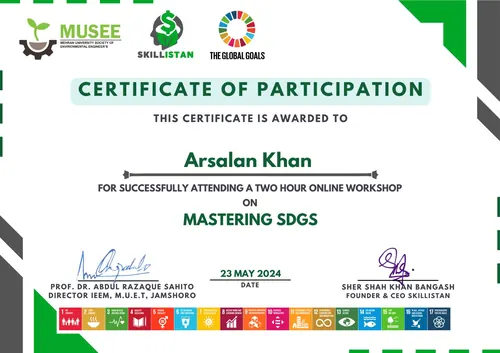
Mastering SDGs Certificate 2024 🔍 Expand
IEEM MUET • MUSEE May 23, 2024

Mastering SDGs — Environmental Engineering

Technical training organized by the Mehran University Society of Environmental Engineers on SDG implementation in water and sanitary engineering.

Signatories: Prof. Dr. Abdul Razaque Sahito (Director IEEM) & Skillistan
Environmental Engineering SDG 6 Clean Water
Inspect Certificate ↗
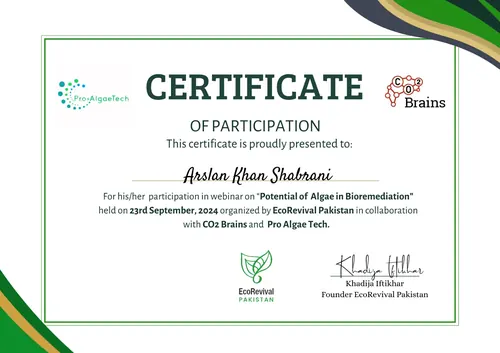
Potential of Algae in Bioremediation Certificate 🔍 Expand
EcoRevival • Biotechnology Sep 23, 2024

Potential of Algae in Bioremediation

Technical webinar focusing on microalgal cultivation, biosorption of aquatic heavy metals, and biotechnological treatment of contaminated industrial wastewater streams.

Signatories: Khadija Iftikhar (Founder EcoRevival) & CO2 Brains
Bioremediation Algal Systems Wastewater Treatment
Inspect Certificate ↗
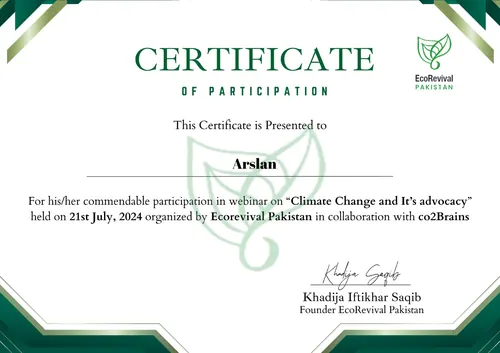
Climate Change and Its Advocacy Certificate 🔍 Expand
EcoRevival • co2Brains Jul 21, 2024

Climate Change and Its Advocacy

Training on evidence-based environmental communication, grassroots climate mobilization, and regional ecological resilience policy frameworks.

Signatories: Khadija Iftikhar Saqib (Founder EcoRevival Pakistan)
Climate Advocacy Policy Ecological Resilience
Inspect Certificate ↗
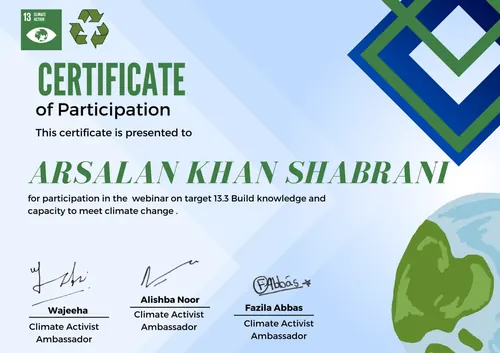
SDG 13 Climate Action Certificate 🔍 Expand
UN SDG 13 • Action 2024

SDG Target 13.3 — Climate Capacity Building

Seminar covering human and institutional capacity building on climate change mitigation, early warning systems, and national adaptation pathways.

Signatories: Wajeeha, Alishba Noor & Fazila Abbas (Ambassadors)
Target 13.3 Capacity Building Mitigation
Inspect Certificate ↗
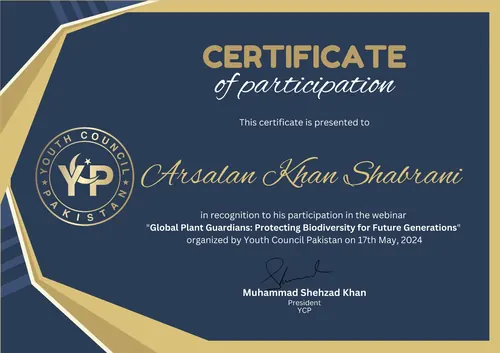
Global Plant Guardians Biodiversity Certificate 🔍 Expand
Youth Council Pakistan May 17, 2024

Global Plant Guardians: Biodiversity

Environmental webinar addressing flora conservation, vegetative cover decline, habitat fragmentation, and biodiversity protection in arid ecosystems.

Signatories: Muhammad Shehzad Khan (President YCP)
Biodiversity Ecosystems Flora Conservation
Inspect Certificate ↗
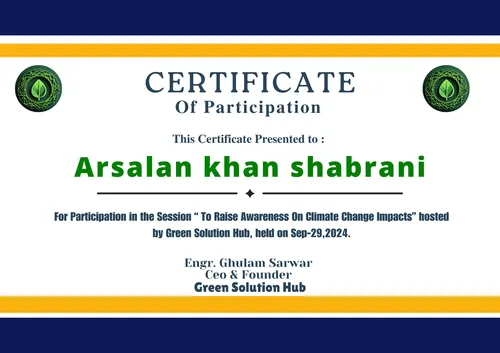
Climate Change Impacts Awareness Certificate 🔍 Expand
Green Solution Hub Sep 29, 2024

Climate Change Impacts Awareness

Participation in regional environmental awareness symposium discussing vulnerability assessments, extreme weather adaptation, and youth initiatives.

Signatories: Engr. Ghulam Sarwar (CEO & Founder Green Solution Hub)
Vulnerability Impact Assessment Adaptation
Inspect Certificate ↗
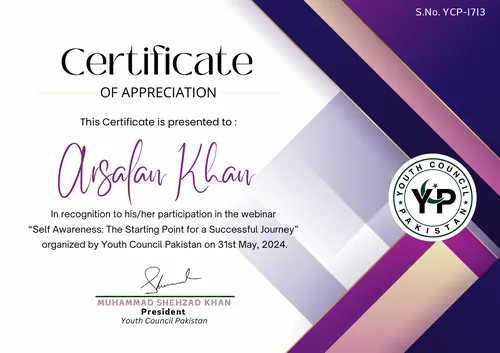
Self Awareness Leadership Certificate 🔍 Expand
Youth Council Pakistan May 31, 2024

Self Awareness & Leadership Development

Professional development webinar examining emotional intelligence, goal setting, scientific career development, and leadership in civic spaces.

Signatories: Muhammad Shehzad Khan (President YCP) · S.No. YCP-1713
Leadership Professional Growth Development
Inspect Certificate ↗